There are many methods that can be used to account for uncertainty and risk in the context of electric and gas utility BCAs and long-term planning in general. These methods typically draw upon practices used in other fields, where extensive work has been done to develop sophisticated approaches to this complex challenge. This chapter summarizes some of those methods at a high level and provides several examples of studies assessing uncertainty and risk in the context of utility planning.
Readers seeking more in-depth guidance on how to account for uncertainty and risk in utility planning are encouraged to review the resources listed in Section 10.6.
10.1. Definitions
10.1.1. Uncertainty and Risk
All analyses of future costs and benefits will include some degree of uncertainty and therefore risk. The goal of a BCA is to provide the information needed to make sound decisions regarding resource investments, despite the uncertainty inherent in resource planning. The value of structured approaches for assessing risk and uncertainty is becoming increasingly apparent in demand-side and supply-side resource assessments.
In the context of planning, uncertainty is defined as the situation where the “correct” or “exact” value of a parameter is not known or cannot be known (EPRI 2015).
In the context of planning, risk is defined as an adverse outcome that can occur with some degree of probability. In statistical terms, risk is the expected value of a potential loss (CERES 2012). Risk is defined by the relationship:
Risk = probability of the outcome occurring * the cost of the outcome
Uncertainty and risk are linked in that uncertainty is what creates the potential for a variety of different outcomes, each with its own probability of occurring. There can also be uncertainty in the costs associated with each such outcome.
For planning and decision-making purposes, there is an additional distinction between uncertainty and risk. Decision-making can be divided into three categories (EPRI 2015):
- Decision under certainty. This is when a decision is made with “perfect” knowledge, where all inputs and assumptions are assumed to be correct. For BCA inputs that are assumed to be certain enough, no additional risk analysis is required. This is referred to as deterministic analysis and decision-making.
- Decision under risk. This is when a decision is made by quantifying the uncertainty and assigning quantitative values to the probability of the outcome occurring and the cost of the outcome. For inputs where reasonable uncertainties can be quantified, probabilistic analysis and decision-making can be applied.
- Decision under uncertainty. This is when there is no, or very little, quantitative knowledge of uncertainties or probabilities. For inputs that are this uncertain, alternative assessments can be applied, including sensitivity and scenario analyses.
Figure 42 presents the relationship between decision-making under certainty, risk, and uncertainty. In the context of electric and gas utility BCAs, all three of these categories are relevant: some inputs can be developed with a reasonable degree of certainty; some inputs are uncertain but can be analyzed using quantitative data; and some inputs are uncertain but are much harder to assign quantitative probabilities to.
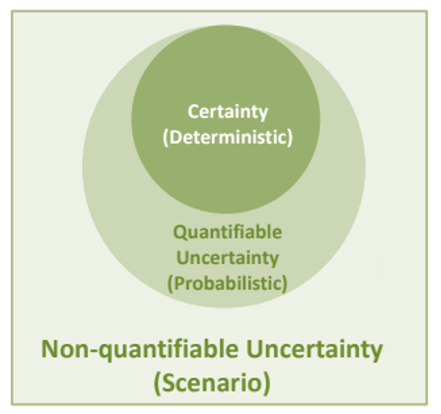 Figure 42. Decision-making under certainty, risk, and uncertainty
Source: Adapted from EPRI 2015, page 3-30, Figure 3-1.
There may not be clear distinctions between which inputs are certain, are uncertain but quantifiable, or are uncertain and not quantifiable. Over time, as additional information is collected and analyzed, inputs that were once considered non-quantifiable, might become quantifiable, and might even become certain enough to eliminate the need for uncertainty or risk analysis.
There is a long list of factors that introduce uncertainty into electric and gas utility planning processes. This includes uncertainties associated with power plant siting, cost, and availability; transmission and distribution facilities siting, cost, and availability; fuel prices; customer energy demand; customer regulatory demand; costs and operating performance of DERs; customer response to DER programs; regulatory and policy shifts; environmental regulations; and more.
The choice of method for addressing uncertainty and risk will depend upon the quality and reliability of the information available at the time of the BCA. Some inputs to a BCA, such as the cost of a DER program in the first year, might be deemed to be certain enough that no additional risk analysis is needed. Some inputs, such as the likelihood of a new environmental regulation, might be deemed to be certain enough to attach a quantitative probability to and to be subject to probabilistic techniques. Other inputs, such as the price of natural gas over the next 20 years, might be deemed to be more challenging to apply a single quantitative probability to and therefore subject to other techniques such as scenario analyses.
10.1.2. Resource Risk and Planning Risk
For the purposes of BCAs, it is useful to be aware of the distinction between resource and planning risk.
10.1.2.a. Resource Risk
Resource risk refers to the risk benefits (or costs) of specific utility resources: generation, transmission, distribution, and DERs.25 Examples of resource risk associated with DERs, relative to traditional supply-side alternatives, include (see ACEEE 2020 Three Rs; RMI 2017):
- Reduced risk due to reduced reliance on fossil fuels that can be subject to limited availability and fluctuating prices. On the other hand, those DERs that result in a net increase in fossil fuel use can lead to a net increase in the risk of associated with fossil fuels.
- Reduced risk resulting from a large number of smaller distributed resources reducing risk of resource performance failure (if one DER fails it will have a much smaller impact on the system compared with one large generation or transmission failure).
- Reduced risk due to modular DERs’ ability to reduce reliance on long lead-time generation, transmission, and distribution investments, thereby creating “option value” that reduces the risk that such investments may not ultimately be needed as conditions change over time.
- Reduced risk of costs of compliance with climate or environmental policies. On the other hand, those DERs that result in a net increase in air emissions can lead to a net increase in the risk of compliance with environmental requirements.
- Reduced risk due to the demand flexibility provided by DERs, especially to address operational requirements of large-scale intermittent resources.
- Either increased or decreased cybersecurity risk that DERs can provide to the utility system.
All utility resource options can have both positive and negative resource risks. For example, a DER might reduce risks associated with fossil fuel price volatility but increase risks associated with customer adoption and operating performance of the DER technology. It is important, therefore, to account for both the increased and reduced risks of resources, i.e., the net resource risk impacts. The extent to which DERs increase or decrease risk to the utility system will depend on the DER type (e.g., energy efficiency, demand response, distributed solar and storage, electrification, or some combination) and the specific use case.
In addition, risks associated with any one utility resource should be determined relative to the risks associated with alternative resources. For example, when estimating the performance risk of a DER in a BCA, that risk should be compared with the performance risk of the resources avoided by the DER.
In the context of BCAs, a net reduction in risk should be considered a risk benefit of the proposed resource, and a net increase in risk should be considered a risk cost of the proposed resource.
Section 10.4 provides examples of jurisdictions that require energy efficiency program administrators to account for risk in their energy efficiency BCAs. All of these examples pertain to resource risk and require program administrators to assign a specific risk benefit to energy efficiency resources.
10.1.2.b. Planning Risk
Planning risk refers to the risks caused by the uncertainties inherent in any forecasting and planning exercise. Planning risk is driven by the uncertainty around the estimated inputs and related forecasts in the BCA and can affect many aspects of a BCA and many different resource types considered in the BCA.
Examples of uncertainties that create planning risk include those related to electricity demand forecasts; gas demand forecasts; fossil fuel price forecasts; siting and construction of energy facilities; environmental requirements; and more.
10.1.2.c. Resource Versus Planning Risk
Note that there is overlap between resource risk and planning risk. For example, the inherent uncertainty in fuel price forecasts creates a resource risk benefit for DERs.
Resource risk is commonly addressed using methods for addressing quantifiable uncertainties (see Section 10.3.1), and planning risk is commonly addressed using methods for addressing unquantifiable uncertainties (see Section 10.3.2), but either method can be used to address either kind of risk.
Ideally, both types of risk should be accounted for in conducting BCAs. If this is done, then it is important to avoid double-counting risk impacts.
10.2. The Importance of Accounting for Uncertainty and Risk in BCAs
Utility decisions about what types of resources to acquire, in what amounts, and at what times are complicated by uncertain and sometimes incomplete information. These uncertainties concern the resources themselves (e.g., installation costs, operating costs, and performance) and the external environment (e.g., environmental regulations, economic growth, fossil-fuel prices, and consumer demand for energy). Utilities have made progress during the past several years in developing and applying improved methods to treat uncertainty. These methods include applications of sensitivity, scenario, portfolio, and decision-analysis methods. Risk assessment methods used by IRP studies in the 1990s are being re-discovered and updated to meet the new challenges of a distributed energy future.
A NARUC risk workshop report concluded that one of the key lessons learned was that workshop participants using “risk informed perspectives performed better than those who used intuition and judgement,” and that “asking fundamental risk-oriented questions helped the best teams clarify their challenges and identify better management strategies” (see NARUC 2016).
The key messages from this and other recent studies are (a) all plans face uncertainty in inputs and outputs, and (b) addressing uncertainty and risk as part of the planning process will lead to better decisions and better outcomes.
Uncertainty is present in every long-term utility planning process, and not taking systematic approaches for assessing uncertainty may be the equivalent of assuming that there is no uncertainty, which is clearly incorrect. Research shows that addressing uncertainty and risk using basic approaches improves the quality of decision-making and helps ensure that monies invested are likely to produce the expected benefits. It also helps avoid heuristic biases in decision-making such as staying with the status quo.
Appropriately assessing risk and uncertainty helps appraise what is known and where there are gaps in the information. This can help in defining program and policy implementation by setting out what needs to be tracked over time to measure progress towards goals, and to incorporate continuous learning as additional information is gathered.
10.3. for Addressing Uncertainty and Risk
10.3.1. Quantifiable Uncertainty
Quantifiable uncertainties are those where probabilities and probability distributions can be calculated. A clear example of a quantifiable, calculable probability would be the likelihood of a given number coming up on the roll of a die, where each side has a probability of 1 out of 6 occurring even though there is uncertainty around which number will actually come up.
BCA inputs that fall in this category include, for example, system load, hydro output, weather-related variability in renewable generation, and performance characteristics of generation facilities. Inputs with this type of uncertainty can be addressed using probability distributions (see EPRI 2015, page 1-6, Figure 1-1).
There are many techniques available to address uncertainty that can be reasonably quantified. These methods are the most common approaches for addressing resource risk but can also be used to address planning risk.
One useful construct is the loss function. The loss function examines the costs associated with the assumption that one set of inputs is presumed to be “true” when in fact another set of values are correct. This approach simply looks at the cost of being wrong. This approach helps understand the relative robustness of decisions to invest in different resources or combinations of resources. The loss function can be quantified with this risk formula, also described above:
Risk = probability of the outcome occurring * the cost of the outcome
Example Study: In a 2002 study, Lawrence Berkeley National Laboratory found that energy efficiency and renewable energy can serve as a hedge against volatile natural gas costs (see Bolinger et al. 2002). The research examined the cost of hedging gas price risk through financial hedging instruments by looking at the price of a 10-year natural gas swap (i.e., what it costs to lock in prices over the next 10 years). The study found that the incremental cost to hedge gas price risk exposure is potentially large enough—particularly if incorporated by policymakers and regulators into decision-making practices such as BCA—to tip the scales away from new investments in variable-price, natural gas-fired generation and in favor of fixed-price investments in energy efficiency and renewable energy.
The inputs to this formula are often not well known. In these cases, a hedge value approach can used to estimate the cost of avoiding a risk by making an alternative investment or buying an alternative product that reduces or eliminates the risk of the investment in question. The alternative investment or product does not need to be procured in order to reduce or eliminate the risk; instead, the cost of the alternative is used to indicate the risk associated with the investment in question. In other words, the cost of the hedge is used as a proxy for the risk benefit.
For example, if a renewable resource is able to reduce the risk associated with natural gas price volatility, then that reduction in volatility can be quantified and monetized by identifying a hedge that could actually be purchased on the market that would achieve the same reduction in risk. Financial hedging instruments, such as the price of a 10-year natural gas swap (i.e., what it costs to lock in prices over the next 10 years), can be used for this purpose. The value of such a hedge, in dollars, can then be considered a risk reduction benefit associated with that renewable resource.
The quantifiable risks in this category are sometimes referred to as “insurable” risks, which means that it is possible to identify and quantify hedge values that could be used to insure against the risk. The unquantifiable risks (described in the following section) are sometimes referred to as “uninsurable” risks because there is not enough quantitative information to determine how to hedge against them (EPRI 2015).
Several examples of jurisdictions that use this method are provided in Section 10.3.3 Table 1.
10.3.2. Unquantifiable or Judgmental Uncertainty
Unquantifiable, or judgmental, uncertainty refers to uncertainty that is especially hard to quantify using probability distributions. In the absence of probabilities, some amount of professional judgment is necessary to address this type of uncertainty. BCA inputs that fall into this category include, for example, long-term economic activities, long-term fuel price variations, changes in supply-side and DER technologies, and changes in laws or regulatory policies (see EPRI 2015, page 1-6, Figure 1-1).
Many approaches are available to address judgmental uncertainties that are hard to quantify. Three primary options are described below. These methods are the most common approaches to addressing planning risk but can also be used to address resource risk. In many analyses, all three of these methods are used. Sensitivity analyses is typically the first step and is then augmented by scenario analyses to capture interdependences, which then sets the stage for likelihood analyses.
Option 1. Sensitivity Analyses
Sensitivity analyses look at how benefits and costs are impacted by different inputs or modeling assumptions. The goal is to determine which inputs or modeling assumptions have the largest impact on the benefit-cost values, and what that impact might be (see UNESCO 2005).
Sensitivity analyses include changing one input assumption at a time to see how those input assumptions are likely to affect the benefits and costs. This typically involves changing key inputs by a given amount, for instance, looking at how an increase or decrease in input values impacts the benefits and costs in the analysis. This could be done for +/- 20% and +/-50% changes in input values, for example.
A tornado diagram is a standard way to present the results of sensitivity analyses across a number of inputs. Figure 43 below presents an example of a tornado diagram, showing the results from low and high values for each variable analyzed.
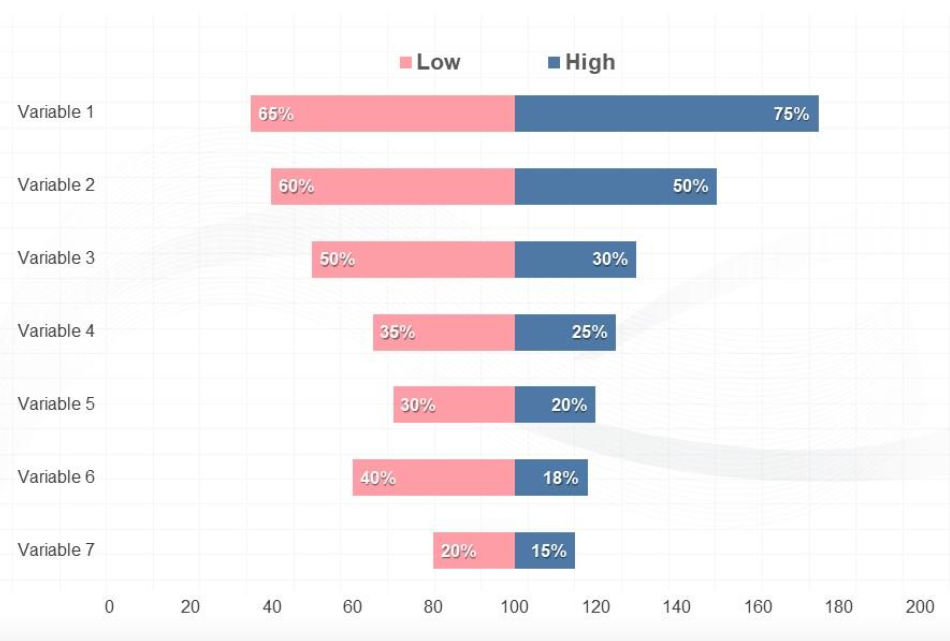 Figure 43. Example tornado diagram for sensitivity analyses
This one-at-a-time approach to accounting for uncertainty is admittedly limited. It does not address questions about non-linearities, asymmetrical risks, and correlations across risks where there is a likelihood that multiple higher than expected outcomes in will move in the same direction (see Czitrom 1999). If these issues are expected to have a significant effect on the outcome, then scenario analysis may be a better method than sensitivity analysis.
Option 2. Scenario Analyses
Scenario analyses can be used to build on and extend sensitivity analyses. They involve building scenarios that account for changes across multiple inputs based upon a specific future outlook or forecasting perspective.
Each scenario should be based on a coherent and internally consistent set of assumptions about key relationships and driving forces (see Spaniol and Rowland 2018). Alternative scenarios may be used as alternative model formulations, as alternative sets of input data, or as both (see Walker et al. 2003).
There are a variety of scenarios that might be useful when conducting BCAs for DERs. For example:
- A high (or low) fuel price scenario, where all fuel prices are higher (or lower) than the base case, which would affect not only avoided costs of DERs, but also electricity and gas demand, and electricity and gas prices.
- An advanced technology scenario, where many technologies are assumed to evolve more rapidly than the base case, which would affect not only the cost of DERs but also the performance assumptions, the availability, and the customer adoption of DERs.
- A decarbonization scenario, where more stringent climate change regulations than the base case are assumed, which would affect many elements in a BCA such as fuel prices, electricity and gas prices, electricity and gas demand, the advancement of clean energy technologies, retirement of fossil-fuel resources, and more.
The key issue in designing scenarios such as these is to account for all the different inputs that might be affected by the scenario assumptions, not just how a single input might be affected as is done with sensitivity analyses.
Example: A 2005 LBNL study looked at actual utility resource plans that included significant amounts of renewable energy additions. The planned additions—primarily coming from wind power—were motivated by the improved economics of wind power, and an increasing recognition of the inherent risks (e.g., natural gas price risk, environmental compliance risk) in fossil-based generation portfolios. The report examined how 12 western utilities treated renewable energy in their resource plans including the utilities’ analysis of natural gas price and environmental compliance risks and examined how the utilities traded off portfolio cost and risk in selecting a preferred portfolio (see Bolinger and Wiser 2005).
Option 3. Likelihood Analyses
Likelihood analyses can be used to prioritize and refine sensitivity and scenario analyses. Likelihood analyses look at how likely different sensitivity assumptions and scenarios are to occur. This involves using as much information as is available to assign probabilities to the key uncertainties in the BCA. If it can be determined that a particular uncertain outcome is extremely unlikely, or that a particular value considered for a sensitivity or scenario is extremely unlikely, then these extremely unlikely outcomes can be given much lower priority in the BCA uncertainty analyses.
One notable exception to this concept is for outcomes that might be extremely unlikely but have a very high cost associated with it, such as severe weather events or aggressive cybersecurity attacks. Remember that risk is the product of the probability and the cost of the outcome. In some cases where the probability is low, the cost of the outcome might be so great as to make it worth accounting for in the BCA uncertainty analysis.
Some methods for quantifying probabilities for this purpose are described in the following section.
10.3.3. Quantifying Uncertainty Using Professional Judgment
Planning exercises sometimes use techniques that rely upon professional judgment to quantify the uncertainty associated with key planning inputs and parameters (see EPRI 2015; Walker et. al., 2003). This requires the use of informed expert opinions to determine a reasonable estimate of likelihoods associated with key uncertainties.26
This “professional judgement” approach typically begins with defining the “pivot factors” in the planning analysis. These are factors that are expected to have a significant impact on the analysis and/or a high degree of uncertainty.
The next step involves estimating probabilities associated with the pivot factors. These probabilities are developed by relying upon experts familiar with utility planning and the pivot factors of interest. Sometimes this is limited to experts from the utility, stakeholders, regulators, and consultants involved in the BCA or long-term planning process.
This method can also include input from select people from outside the planning process, if it is believed that additional insights will be valuable. For example, regional experts that have insights into the economic growth, population/customer growth, and forecasts of energy prices have been used in past efforts. In addition, if specific DER technologies (e.g., storage, PVs, heat pumps, etc.) are important to the BCA outputs, having technology experts provide information on the range of performance and/or the costs of operation of these technologies can be useful.27
It is important to recognize that professional judgment should be informed by the specific context of the BCA. This includes developing context around BCA outcomes by examining the range and likelihoods for different pivot factors. In other words, the experts used in this method should be apprised of all the factors in the BCA that might affect uncertainty.
Professional judgment can also be used to establish reasonable lower and upper bounds (i.e., a range of outcomes) of key uncertain pivot factors. These estimates should be accompanied by a description of the factors that drive the bounding estimates: What causes the lower bound value and the upper bound value? They should also include a discussion of where, within the range, the most likely outcome is expected to fall. These results would lead to high, medium, and low cases, with probabilities ascribed to each case.
This method, while approximate because it is based on judgment in the face of uncertainty, offers several benefits:
- Reducing potential biases that can occur in long-term planning analyses.
- Promoting better decision-making by accounting for uncertainty more directly and transparently.
- Providing insights into what actions can be taken to manage the risks. By better understanding the factors driving uncertainty, actions can be taken to manage outcomes or create options that allow for learning over time and sequential decision-making.
- Offering a relatively low-cost way to account for uncertainty.
10.4. Jurisdictions that Account for Risk Impacts
While there are well documented risk benefits of DERs, in particular for energy efficiency, not many jurisdictions account for these benefits in their BCAs. This is largely because of the complexity of quantifying the reduced risk. Table 83 shows where states account for risk, and the general approach or methodologies used to quantify a risk value for inclusion in the BCA (see ACEEE 2020 Three Rs).
Table 83. Examples of jurisdictions that require accounting for energy efficiency risk benefits
| Entity |
Value of reduced risk from efficiency |
General Approach |
| District of Columbia Sustainable Energy Utility |
5% |
Proxy for the value of reduced risk as an adder to the other benefits of energy efficiency (see DC SEU 2016) |
| Maryland |
$0.007/kWh |
Included as an adder to avoided cost of energy calculation to reflect the avoided costs of both avoided business risks and avoided ancillary services |
| NW Natural |
$0.37/MMBTU |
Levelized average fuel-price risk avoidance used in integrated resource planning and cost-effectiveness testing for natural gas energy efficiency (see NW Natural 2018) |
| Northwest Power and Conservation Council |
$0.02/kWh |
Accounting for reduced risk of efficiency in utility resource planning compared to other resource options (see ETO 2107) |
| Pacific Power |
$0.00145/kWh |
Levelized average fuel-price risk avoidance used in integrated resource planning and cost-effectiveness testing (see ETO 2017) |
| Portland General Electric |
$0.0058/kWh |
Levelized average fuel-price risk avoidance used in integrated resource planning and cost-effectiveness testing (see ETO 2017) |
| Vermont |
5% – 10% |
Costs of gas DERs are reduced by 10% and costs of electricity DERs are reduced by 5% to reflect the net risk reduction benefits of DERs (see VT PUC 2020) |
Source: ACEEE 2020 Three Rs, pages 10-11, Table 1.
The predominate approach used to account for resource risk in the table above is to recognize the price hedge value of DERs using the Quantifiable Uncertainty approach described in Section 10.3.1. For example, the Energy Trust of Oregon has developed estimates of the costs of hedging fossil fuels and used those costs to develop a “risk reduction value” as an adder to its estimates of future electric and gas avoided costs used to value energy savings from efficiency measures and programs (see ETO 2017).
In the case of Vermont, the Commission has established proxies to account for the risk benefits associated with demand-side options. The risk proxies are based on reviews of risk analyses in other parts of the country and on proposals made by intervenors in Vermont dockets. The proxies are ultimately decided upon by the Commission. The original risk proxy reflected the energy efficiency resource risk benefits of “flexibility, short lead time, availability in small increments, and ability to grow with load” (see VT PUC 1990). The proxy is applied by reducing the cost of energy efficiency measures by a pre-determined percentage. At first, the proxy was set at 10 percent to reflect the risk benefits of all energy efficiency programs relative to supply-side alternatives. Recently, the Commission recognized that the risk benefits of electric efficiency measures are somewhat muted by the wholesale electricity market in New England, and therefore modified the risk proxy for electricity energy efficiency to 5 percent but kept the risk proxy for gas energy efficiency at 10 percent. Further, the VT Commission now applies these risk benefit proxies to all demand-side resources (see VT PUC 2020, page 46).
10.5. Further Research
As stated above, this chapter provides a high-level summary of concepts that can be used to account for risk in BCAs. While there is substantial information available on how to address risk in long-term utility planning, as indicated in the following section, further research would significantly enhance practices regarding how risk techniques can be applied to BCAs for DERs. For example, additional research could help with the following questions:
- In what ways do DERs create resource risk benefits or risk costs, beyond those identified to date for DERs?
- What are the best techniques for quantifying and monetizing resource risks?
- What are the best techniques for addressing planning risk in utility BCAs for DERs?
- Can some of these techniques be simplified to make them more readily accessible and usable for BCA practitioners?
- Can proxies for resource risks be developed for each DER type to allow for easy and quick application in BCAs for DERs in any jurisdiction?
10.6. Resources for Accounting for Uncertainty and Risk
American Council for an Energy-Efficient Economy. 2020. (ACEEE 2020 Three Rs). Measuring the Three Rs of Energy Efficiency: Risk, Reliability, Resilience. Relf and Jarrah. January.
Arbel and R.M. Tong. 1982. “On the generation of alternatives in decision analysis problems.” Journal of the Operational Research Society, vol. 33. www.jstor.org/stable/2581647.
Beecher, Jan and Steve Kihm. 2016. Risk Principles for Public Utility Regulators. Michigan State University Press.
Bolinger, M. and R. Wiser. 2005. “Balancing Cost and Risk: The Treatment of Renewable Energy in Western Utility Resource Plans.” Lawrence Berkeley National Laboratory – LBNL-5845. www.emp.lbl.gov/publications/balancing-cost-and-risk-treatment.
Bolinger, M. and R. Wiser. 2008. “The Value of Renewable Energy as a Hedge Against Fuel Price Risk: Analytic Contributions from Economic and Finance Theory.” Lawrence Berkeley National Lab LBNL-2022E. www.osti.gov/biblio/962658.
Bolinger, M., R. Wiser, D. Bachrach, and W. Golove. 2002. (Bolinger et al. 2002). “Quantifying the value that energy efficiency and renewable energy provide as a hedge against volatile natural gas prices,” ACEEE Summer Study on Energy Efficiency in Buildings, Pacific Grove, CA. www.aceee.org/files/proceedings/2002/data/index.htm.
Bull, M. and A. Ford. 1988. “Closing the Loop on Uncertainty: Does Bonneville’s Conservation Policy Analysis Model Make Hypersens?” In Proceedings of the ACEEE Summer Study on Energy Efficiency. www.aceee.org/files/proceedings/1988/data/index.htm.
Cazalet, E.G., G.E. Clark, G.E., and T.W. Keelin. 1978. “Costs and Benefits of Over/Under Capacity in Electric Power System Planning.” Electric Power Research Institute (EPRI) EA-927 Research Project 1107 Final Report, October. www.osti.gov/servlets/purl/6435294.
CERES. 2012. Practicing Risk-Aware Electricity Regulation: What Every State Regulator Needs to Know. Binz, Sedano, Furey, and Mullen. April. www.ceres.org/resources/reports/practicing-risk-aware-electricity-regulation-what-every-state-regulator-needs.
Colorni, I. and A. Tsoukias. 2020. “Designing Alternatives for Decision Problems.” Journal of Multi-Criteria Decision Analysis. www.hal.archives-ouvertes.fr/hal-02787638/document.
Compass Resource Management. 2013. “Develop Alternatives,” Structured Decision Making, Vancouver, BC. structureddecisionmaking.org/steps/alternatives/.
Czitrom, Veronica. 1999. “One-Factor-at-a-Time Versus Designed Experiments.” American Statistician. Vol. 53 (2). www.jstor.org/stable/2685731?origin=crossref.
District of Columbia Sustainable Energy Utility. 2016. (DC SEU 2016). Multiyear Contract. Contract No. DOEE-2016-C-0002. Washington, DC: DC SEU.
Electric Power Research Institute. 2015. (EPRI 2015). PRA White Paper: A White Paper on the Incorporation of Risk Analysis into Planning Processes. Prepared for the Eastern Interconnection State’s Planning Council and the National Association of Regulatory Commissioners. January. www.astrape.com/wp-content/uploads/2019/01/EISPC_WhitePaper_FINAL_EPRI.pdf.
Energy Trust of Oregon. 2017. (ETO 2017). Energy Trust Electric and Gas Avoided Cost Update for Oregon for 2018 Measure and Program Planning. Portland: Energy Trust of Oregon.
Ford, A. and J. Geinzer. 1990. “Adding Uncertainty to Least-Cost Planning: A Case Study of Efficiency Standards in the Northwest.” Energy Policy 18(4), 331-350, May. www.sciencedirect.com/science/article/abs/pii/0301421590901916?via%3Dihub.
Gavin, M. n.d. “Decision-Making in Management: 5 Common Pitfalls to Avoid.” Harvard Business School. HBS.edu website. online.hbs.edu/blog/post/decision-making-in-management.
Hammond, J. S., Keeney, R. L, and H. Raiff. 1998. “The Hidden Traps in Decision Making”. Harvard Business Review. 84 (1): 118–126. hbr.org/1998/09/the-hidden-traps-in-decision-making-2.
Hirst, E. 1988. “Incorporating Uncertainty into Electric Utility Long-Term Planning and Decision Making,” In Proceedings of the ACEEE Summer Study on Energy Efficiency. www.aceee.org/files/proceedings/1988/data/papers/1988_V8_010.pdf.
Hirst, E. 1990. “Flexibility benefits of demand-side programs in electric utility planning” The Energy Journal, Vol. 11, Issue 1. www.jstor.org/stable/41323442.
Hirst, E., E. Yourstone, and M. Gettings. 1991. “Resource planning model treats electric-utility uncertainties.” IEEE Computer Applications in Power. Vol 4, Issue: 4, Oct. www.ieeexplore.ieee.org/document/93204?arnumber=93204.
Lazar, J., and K. Colburn. 2013. Recognizing the Full Value of Energy Efficiency (What’s under the Feel-Good Frosting of the World’s Most Valuable Layer Cake of Benefits). Regulatory Assistance Project. www.raponline.org/wp-content/uploads/2016/05/rap-lazarcolburn-layercakepaper-2013-sept-09.pdf.
NARUC Research Lab. 2016. Risk Management in Critical Infrastructure Protection: An Introduction for State Utility Regulators. Keough and Thomas. September. www.pubs.naruc.org/pub/D10AF40A-AD04-3983-7421-9FBE970D87F3.
Rocky Mountain Institute. 2017. (RMI 2017). The Billion-Dollar Costs of Forecasting Electricity Demand: How distributed energy resources can ease the challenges of grid investment planning. Dyson. M. and A. Engel.
Rocky Mountain Institute. 2018. (RMI 2018 CEP Economics). The Economics of Clean Energy Portfolios: How Renewable and Distributed Energy Resources are Outcompeting and can Strand Investment in Natural Gas-Fired Generation. Dyson, M., A. Engel, and J. Farbes. rmi.org/wp-content/uploads/2018/05/RMI_Executive_Summary_Economics_of_Clean_Energy_Portfolios.pdf.
Salci, S. and G.P. Jenkins. 2016. “Incorporating Risk and Uncertainty in Cost-Benefit Analysis,” Development Discussion Paper: 2016-09. September. www.ssrn.com/abstract=2845560.
Saltelli, A. 2002. “Sensitivity Analysis for Importance Assessment” Risk Analysis 22(3):579-90, July. www.researchgate.net/publication/11287754_Sensitivity_Analysis_for_Importance_Assessment.
Spaniol, M.J. and N.J. Rowland. 2018. “Defining Scenario.” Futures Foresight Sci., John Wily & Sons, Ltd. www.onlinelibrary.wiley.com/doi/full/10.1002/ffo2.3.
UNESCO. 2005. Chapter 9: Model Sensitivity and Uncertainty Analysis in Water Resources Systems Planning and Management. ISBN 92-3-103998-9. www.ecommons.cornell.edu/bitstream/handle/1813/2804/09_chapter09.pdf;sequence=12 2004.
Vermont Public Utility Commission. 2019. (VT PUC 2019). Investigation into Least-Cost Investments, Energy Efficiency, Conservation, and Management of Demand for Energy, Docket No. 5270. April 16.
Vermont Public Utility Commission. 2020. (VT PUC 2020). Order on the EEU Screening Values for Use Starting in 2021. Case No. 19-0397-PET. July 6.
Walker, W.E., Harremoes, P. And J. Rotmans. 2003. “Defining Uncertainty: A Conceptual Basis for Uncertainty Management in Model-Based Decision Support.” Integrated Assessment. Vol. 4, No. 1. www.researchgate.net/publication/46641920
25 Resource risk is sometimes referred to as “portfolio” risk because it represents the risk effect of one resource relative to the entire portfolio of resources.
26 Some studies refer to this approach as using “subjective judgment” (see EPRI 2015). Subjective is defined as being based on a personal interpretation of data, while objective is defined as being based on factual data. The term “professional judgment” is used in this handbook because estimates of the likelihoods of uncertainties can be based on a combination of factual information and expert interpretation of that information.
27 This method is sometimes referred to as the Delphi approach because it relies upon a panel of experts whose combined knowledge represents the best available insights on how to forecast the future.