Reliability and resilience impacts can affect the utility system, host customers, and society. This chapter addresses each perspective separately.
8.1. Reliability
8.1.1. Definition
The U.S. Department of Energy defines reliability as the ability of the system or its components to prevent or withstand instability, uncontrolled events, cascading failures, or unanticipated loss of system components (see DOE 2017, page 4-1). Reliability is distinct from resilience in that the latter is focused more on addressing severe weather events and major equipment failures, reducing long-duration outages, and reducing outages for critical needs customers and end-uses (see Section 8.2.1).
Figure 39 indicates how there are many different aspects to reliability. These include transmission, distribution, and generation (adequacy and operational) aspects. Most electricity outages are caused by distribution system failures or interruptions. Transmission system failures or interruptions are the second greatest cause of major electricity outages. Generator availability and operation are rarely the cause of major electricity outages.
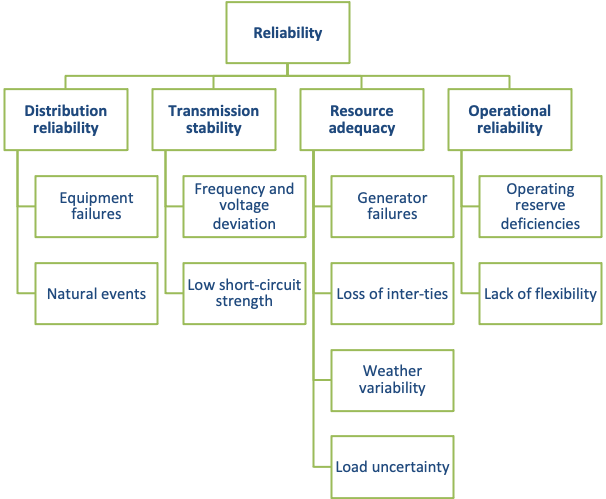 Figure 39. Different aspects of reliability
Source: Adapted from LBNL 2021 R&R of EE, page 4, Figure 2.
Utilities are typically subject to minimum reliability performance standards for both the bulk power system and the local distribution system. These performance standards are often monitored and enforced using metrics and financial incentives related to the frequency, duration, and extent of power outages experienced by customers. Commonly used metrics include the system average interruption duration index (SAIDI), the system average interruption frequency index (SAIFI), and the customer average interruption duration index (CAIDI).
Further, in order to maintain a reliable source of electric or gas capacity, vertically integrated utilities use planning reserve margins that are designed to provide enough extra generation or production capacity beyond forecasted peak demand to minimize outages and outage times. These reserve margins are designed to be large enough to meet certain reliability criteria, such as ensuring that the loss of load probability (LOLP) does not exceed one day in ten years.
By lowering loads or increasing generation on the grid, DERs can reduce the probability and/or duration of customer service interruptions (see U.S. EPA 2018, page 3-35). The magnitude of the value of this benefit will vary, with less value to systems that have excess capacity or newly installed capacity, and greater value to systems that are short of capacity or have a large amount of aging infrastructure.
Since reliability and resilience impacts are so similar and potentially overlapping, it is important that any estimate of DER reliability and resilience benefits avoid double-counting.
To the extent that DERs reduce capacity requirements at the bulk system level, they also reduce associated reliability requirements. Consequently, ancillary service, generating capacity, and transmission capacity values implicitly include the value of reliability for a set standard. In other words, the $/MW value of a DER’s avoided ancillary services requirements, avoided generating capacity, and avoided transmission capacity include that DER’s contribution to meeting reliability requirements. Therefore, calculations of reliability benefits for DERs should include only the incremental reliability benefits beyond those captured in the avoided costs for ancillary services, generation capacity, and transmission capacity.
Planning reserve margins and other reliability requirements are often influenced by the size and the diversity of the resources on the system. For example, a system made up of a few large central generators will require a higher reserve margin than one made up of many decentralized generators and DERs. This creates an inherent reliability advantage of DERs.
Most reliability benefits accrue to the utility system. Some reliability benefits, however, might accrue to the host customer or customers. An example of this would be when a micro-grid or a combination of distributed generation and distributed storage allows the host or hosts to continue to have power during a power outage. Other reliability benefits might accrue to society—for instance when a micro-grid or a combination of distributed generation and distributed storage allows critical customers such as a police stations, fire stations, or hospitals to continue to provide public services during a power outage. In those instances where the distinction between utility system, host customer, and societal impacts matters, the reliability benefits should be calculated separately for these three different perspectives.
Since reliability and resilience impacts are so similar and potentially overlapping, it is important that any estimate of DER reliability and resilience benefits avoid double-counting.
8.1.2. Methods for Calculating Reliability Impacts
Reliability Assessment Framework
- Define reliability metrics
- Define and quantify baseline reliability
- Characterize the potential reliability impacts of DERs
- Quantify the reliability impacts from the proposed DERs
- Calculate the net reliability impacts of the proposed DERs
- Calculate the dollar values of the reliability impacts
States Preferences (Bottom Up)
- Use customer surveys such as customer interruption cost surveys
- Gather information on the costs resulting from shorter duration, localized power interruptions borne by customers
Revealed Preferences (Bottom Up)
- Use actual customer purchasing behavior to infer a valuation of non-market goods
- Use defensive behavior methods identify the amount that customers have paid to avoid the negative consequences of a power interruption
- Use damage cost methods calculate the actual costs that may be experienced by customers during a power interruption
Quantitative Models (Bottom Up)
- Use tool such as LBNL’s ICE model to value reliability and resilience impacts for short (<8 hours) outage durations
- OR use distribution system using load flow analysis to model improvements in reliability if detailed circuit-specific data is available
Macroeconomic Methods
- Use indicators such as economic output and employment to analyze effects of power outages on regional economies to capture societal macroeconomic aspect
- Use methods that analyze economic output and job impacts of changes to the electricity or gas industries
Framework for Assessing Reliability
Reliability impacts can be estimated by comparing the reliability metrics from a baseline scenario with those from a scenario that includes the proposed DERs, using the steps in Table 75.
Table 75. Reliability assessment framework steps overview
| Step 1 |
Define reliability metrics
This requires identifying metrics that can be used to define, assess, and prioritize reliability impacts (see LBNL 2021 R&R for EE). There are many such metrics available for this purpose. Table 76 presents some examples of commonly used metrics. For the purpose of assessing reliability in a BCA, it may be useful and practical to focus on a subset of relevant metrics that address key areas of reliability, such as LOLP, Planning Reserve Margin, SAIDI, and SAIFI. Table 76 below provides examples of metrics. |
| Step 2 |
Define and quantify baseline reliability
This is equivalent to developing a Reference Case, where the relevant reliability metrics (from Step 1) are quantified and presented to indicate the level of reliability that would be expected without the DERs being evaluated in the BCA. It is especially important to determine the values for the monetary metrics, because these will be used to determine the dollar value of reliability. |
| Step 3 |
Characterize the potential reliability impacts of DERs
This critical step includes an assessment of the potential for the proposed DERs to affect the relevant reliability metrics (from Step 1). This requires a thorough analysis of the DER types and load impact profiles. Some DER types, such as energy efficiency and distributed PV, might passively affect reliability by simply reducing load during peak hours or by enhancing system diversity and adding multiple modular, decentralized resources. Other DER types, such as demand response and distributed storage, might actively affect reliability by operating at times when additional reliability is needed. Still other types of DERs, including micro-grids or combinations of distributed PV and storage, can continue to provide electricity service to host customers during an outage. These different types of reliability impacts should be identified for each DER type. |
| Step 4 |
Quantify the reliability impacts from the proposed DERs
This is equivalent to developing a DER Case, where the relevant reliability metrics (from Step 1) are quantified and presented to indicate the level of reliability that would be expected as a result of installing those DERs. Again, it is especially important to determine the values of the monetary metrics. |
| Step 5 |
Calculate the net reliability impacts of the proposed DERs
This requires subtracting the reliability impacts from the DER Case (from Step 4) from the reliability impacts of the Reference Case (from Step 2). |
| Step 6 |
Calculate the dollar values of the reliability impacts
This requires applying a dollar value to the relevant reliability metrics. For example, the system LOLE (in hours per year) can be multiplied by the value of lost load, or VOLL, (in dollars per hour) to calculate the value of the change in reliability (in dollars per year). Methods for determining the dollar value of reliability are discussed below. (See LBNL 2021 R&R of EE, page 16 for a discussion of the challenges of using VOLL in BCAs.) |
In some cases, an additional step may be warranted. In those instances where the distinction between utility system, host customer, and societal impacts matters, the reliability benefits should be calculated separately for these three different perspectives.
Table 76. Examples of reliability metrics
| Distribution System |
System Average Interruption Duration Index (SAIDI) |
| System Average Interruption Frequency Index (SAIFI) |
| Customer Average Interruption Duration Index (CAIDI) |
| Momentary Average Interruption Frequency Index (MAIFI) |
| Customers Experiencing Multiple Interruptions (CEMI) |
| Customers Experiencing Longest Interruption Duration (CELID) |
| Transmission System |
N-1 analysis |
| Loss-of-Load Probability (LOLP) in terms of days per ten years |
| Loss-of-Load Expectation (LOLE) in terms of hours per year |
| Generation System |
Planning Reserve Margin |
| Effective Load Carrying Capacity (ELCC) |
| LOLP and LOLE |
| Monetary |
Value of Lost Load (VOLL) |
| Customer Interruption Costs (CIC) |
| Service Restoration Costs |
Methods for Determining Dollar Values of Reliability
Multiple methods are used to calculate the dollar values of reliability. Some of the most common methods are summarized below.
Bottom-Up Methods
Stated Preferences
Surveys are a common approach to identify stated preferences for a variety of different economic and societal impacts. Customer interruption cost surveys are the most common method determining dollar values for reliability because they can estimate direct costs for a variety of power interruption scenarios. These scenarios can range from previous interruptions experienced by customers to different, but closely related, hypothetical interruptions (see NARUC 2019, page 17).
Customer interruption cost surveys are particularly well-suited for gathering information on the costs that result from shorter duration, localized power interruptions because respondents have experienced these types of interruptions in the past and because the costs consist largely of the direct costs that are borne solely by the respondents (see LBNL 2021 Resilience, pages 17-19).
Revealed Preferences
The revealed preferences approach is used in many applications to develop a dollar value for costs or benefits that are not typically priced in an economic transaction. It uses actual customer purchasing behavior to infer a valuation of non-market goods. Defensive behavior and damage cost methods are examples of revealed preference approaches that have been used to establish the value of avoiding power interruptions.
- Defensive behavior methods identify the amount that customers have paid to avoid the negative consequences of a power interruption (see NARUC 2019, page 17). For example, the costs of purchasing and maintaining a back-up diesel generator or a micro-grid could represent the value of avoiding power interruptions.
- Damage cost methods calculate the actual costs that may be experienced by customers during a power interruption (see NARUC 2019, page 17). As one example, customer VOLL can be determined by calculating the value of leisure time for individuals and calculating the proportion of that leisure value that is dependent on electricity. The value of leisure can then be estimated using the assumption that, at the margin, an hour of leisure is valued the same as the income generated from an additional hour of work, which is valued at a relevant labor rate (see CEPA 2018).
Quantitative Models
Many states and utilities use the Lawrence Berkeley National Laboratory’s Interruption Cost Estimate (ICE) Calculator to value reliability and resilience impacts. The ICE Calculator is a web-based tool that estimates outage impacts on consumers while considering the probability of the outage’s occurrence. This tool is designed for electric reliability planners at utilities, government organizations, and other entities that are interested in estimating interruption costs and/or the benefits associated with reliability and resilience improvements in the United States. This tool relies in part on customer surveys (i.e., stated preferences) to estimate the monetary VOLL associated with power outages for different customer and outate types (see LBNL ICE).
The ICE model has several limitations, however. The data is focused on relatively short outages (less than 24 hours) and is not intended to be used for outage durations exceeding eight hours, making the model less useful for resilience purposes. In addition, for large commercial and industrial (C&I) customers, the VOLL is based on GDP/kWh by state, while for small C&I customers and residential customers, it uses survey data from surveys conducted by 10 utilities in certain parts of the country. No surveys were performed for some regions or states, and much of the survey data is outdated (ranging from 1989 to 2012). LBNL is working on addressing some of these limitations (see LBNL 2021 Eto).
Depending on data availability, it might also be possible to model improvements in reliability (above minimum operating standards) from DERs on the distribution system using load flow analysis. Detailed circuit-specific data would be required to conduct such analysis, including the number of customers by class, the current level of reliability, and future capacity needs.
Methods for Calculating Macroeconomic Impacts
Economy-wide methods analyze the effects of power outages on regional economies using indicators such as economic output and employment (see NARUC 2019, page 18; LBNL 2021 Resilience, pages 19-25). These approaches do not necessarily capture the full impact of outages on customers. Instead, they capture one aspect of outages: the societal macroeconomic aspect.
A variety of methods and models are available to analyze economic output and job impacts of changes to the electricity or gas industries. These include rules-of-thumb factors; input-output models (e.g., IMPLAN and REMI); econometric models; general equilibrium models; and hybrid models (see Section 7.4.2).
Tools for Calculating Reliability Impacts
Several tools have been established to facilitate the calculation of reliability impacts. Table 77 presents a summary of these tools. Additional discussion of strengths, limitations, and uses of these tools is provided in NARUC & NASEO 2022.
Table 77. Current and pending tools for calculating reliability impacts
| Method/Tool |
Developers |
Advantages and New Additions |
Available |
| Interruption Cost Estimator 2.0 Tool |
- Lawrence Berkeley National Laboratory
- Edison Electric Institute
|
- Updated calculations of power interruption costs.
- New willingness-to-pay surveys that will populate the tool with more recent data and more geographic specificity for power interruption cost estimates.
- New data on customer responses to longer-duration power interruptions.
|
Expected 2023 |
| Customer Damage Function Calculator Tool |
- National Renewable Energy Laboratory
|
- Helps individual facilities (or groups of similar facilities) calculate power interruption costs, based on the specific losses that they project will occur.
- Guided questions lead facilities through their own assessments.
- Graphical summary of initial damage costs, and costs over time.
|
2021 |
| Social Burden Method |
- Sandia National Laboratories
- University of Buffalo
|
- Provides a metric for the social burden of power outages that emphasizes the needs of communities during power outages, instead of emphasizing protecting critical infrastructure for its own sake.
- Adopts a more neutral treatment of the willingness to pay vs. the ability to pay for resilience.
|
Pilot 2021-2022 |
| FEMA Benefit-Cost Analysis Tool |
- Federal Emergency Management Agency
|
- Provides quantitative values for lost emergency services, such as police, fire, and emergency medical response.
- New pre-calculated values specifically for hospitals published in 2021.
- The use of FEMA values aligns with the application requirements of FEMA grant programs.
|
2021 |
| Power Outage Economics Tool (POET) |
- Lawrence Berkeley National Laboratory
|
- Takes into account how utility customers adapt their behavior during longer duration power interruptions.
- Uses surveys of utility customers to collect data on how they would actually behave during a power outage.
|
Pilot 2021-2022 |
8.1.3. Resources for Calculating Reliability Impacts
American Council for an Energy Efficient Economy. 2020. (ACEEE 2020 Health). Making Health Count: Monetizing the Health Benefits of In-home services delivered by Energy Efficiency Programs. May. www.aceee.org/research-report/h2001.
Federal Energy Regulatory Commission. 2018. (FERC 2018). Grid Reliability and Resilience Pricing. Docket Nos. RM18-1-000 and AD18-7-000. January 8. cms.ferc.gov/sites/default/files/2020-05/20180108161614-RM18-1-000_0.pdf.
Institute for Policy Integrity 2018. (IPI 2018). Toward Resilience: Defining, Measuring, and Monetizing Resilience in the Electricity System. Burcin Unel and Avi Zevin. August.
Lawrence Berkeley National Laboratory. 2021. (LBNL 2021 Eto). “Interruption Cost Estimate (ICE) Calculator.” Presentation to the Michigan Power Grid Electric Distribution Planning Benefit Cost Analysis Session. Joe Eto. November 3. www.michigan.gov/documents/mpsc/110321_BCA_presentation_final_739963_7.pdf.
Lawrence Berkeley National Laboratory. 2021. (LBNL 2021 Resilience). A Hybrid Approach to Estimating the Economic Value of Enhanced System Resilience. Sunhee Baik, Nichole Hanus, Alan Sanstad, Joe Eto, Peter Larsen. February.
Lawrence Berkeley National Laboratory. n.d. (LBNL ICE). Interruption Cost Estimator Calculator Website. www.icecalculator.com/home.
National Association of Regulatory Commissioners. 2019. (NARUC 2019). The Value of Resilience for Distributed Energy Resources: An Overview of Current Analytical Practices. Prepared by Converge Strategies. April.
National Association of Regulatory Commissioners. 2020. (NARUC 2020). Advancing Electric System Resilience with Distributed Energy Resources: A Review of State Policies. Kiera Zitelman. April.
National Association of Regulatory Commissioners. 2022. (NARUC & NASEO 2022). Valuing Resilience for Microgrids: Challenges, Innovative Approaches, and State Needs. Prepared by NARUC, National Association of State Energy Officials, and Converge Strategies. February. pubs.naruc.org/pub/1B571AB6-1866-DAAC-99FB-2509F05E4A67
North American Electric Reliability Corporation. 2011. (NERC 2011). Methods to Model and Calculate Capacity Contributions of Variable Generation for Resource Adequacy Planning. Michael Milligan, National Renewable Energy Laboratory. April 12. www.nrel.gov/docs/fy11osti/51485.pdf.
U.S. Department of Energy. 2013. (U.S. DOE 2013). Presidential Policy Directive 21 (PPD-21): Critical Infrastructure Security and Resilience. February 2013. www.energy.gov/ceser/presidential-policy-directive-21.
U.S. Department of Energy. 2017. (U.S. DOE 2017). Transforming the Nation’s Electricity System: The Second Installment of the Quadrennial Energy Review. “Chapter IV: Ensuring Electricity System Reliability, Security, and Resilience.” www.energy.gov/sites/prod/files/2017/02/f34/Quadrennial%20Energy%20Review–Second%20Installment%20%28Full%20Report%29.pdf.
8.2. Resilience
8.2.1. Definition
Resilience is increasingly recognized as an important consideration separate from and in addition to reliability. DERs can have important impacts on the resilience of an electric or gas system. Several definitions of resilience have been used in recent years, including:
- “Robustness and recovery characteristics of utility infrastructure and operations, which avoid or minimize interruptions of service during an extraordinary and hazardous event” (see NARUC 2013, page 1).
- “The ability to withstand and reduce the magnitude and/or duration of disruptive events, which includes the ability to anticipate, absorb, adapt to, and/or rapidly recover from such an event” (see FERC 2018, page 13; IEEE 2021, page 8).
- “The ability of a power system and its components to withstand and adapt to disruptions and rapidly recover from them” (see U.S. DOE 2013).
- “The ability of the system and its components (i.e., both the equipment and human components) to minimize the damage and improve recovery from the non-routine disruptions, including high impact, low frequency events, in a reasonable amount of time” (see NATF 2021, page 1).
Consistent across these definitions is the notion that major events will occur, but more resilient systems will minimize the effects of these events—by both reducing the likelihood or scope of an outage and by reducing the duration of outages that do occur.
Resilience vs. Reliability: Resilience differs from reliability in that it addresses severe outage events and long-duration outages. Resilience also differs from reliability in that it is more focused on critical need customers and loads. Critical need customers include customers who rely upon electricity and gas services more than average customers; for example, police stations, fire stations, hospitals, other health care centers, water and wastewater processing facilities, military installations, customers relying upon life support systems, community emergency shelters, communications systems, and more.
Since reliability and resilience impacts are so similar and potentially overlapping, it is important that any estimate of resilience benefits from DERs avoid double counting the reliability benefits associated with those DERs.
Not all DERs have resilience impacts. When determining the potential magnitude of DER resilience impacts, it is useful to start with a set of traits that DERs might have that enable them to provide resilience benefits (see NARUC 2020, page 4):
- Dispatchability, when DERs can respond to a disruption at any time with little to no advanced warning.
- Islanding capability, when DERs have the capability to isolate specific loads, a customer, or customers from the rest of the distribution grid and continue to serve those customers during the outage.
- Siting at critical customer locations, when DERs are located at critical loads (e.g., police stations) or at critical points in the grid (e.g., residential apartment buildings).
- Fuel security, when DERs do not rely upon the availability or deliverability of a limited physical fuel to operate.
- Quick ramping, when DERs are capable of changing output quickly to respond to rapidly changing load.
- Grid services, when DERs can provide voltage support, frequency response, and other grid services.
- Decentralization, when DERs are sized and sited to support distributed load.
- Flexibility, when DERs can be deployed and operated quickly (relative to other supply-side resources) at locations and times where resources are needed.
Microgrids are frequently attributed with resilience benefits because they have most or all these traits (see NARUC & NASEO 2022). Similarly, distributed solar resources paired with distributed storage are generally recognized as offering resilience benefits. Energy efficiency is sometimes attributed the following resilience benefits: (a) it reduces demand, which allows customers to install smaller backup or emergency power sources at lower cost; (b) lower customer demand can allow generation resources to restart more easily after power blackouts; and (c) efficient building shells and appliances can allow customers to live safely in their homes longer during extended outages (see ACEEE 2020 Three Rs, page 21).
8.2.2. Methods for Calculating Resilience Impacts
Framework for Assessing Resilience Impacts
Few jurisdictions, if any, have determined values for resilience for the purpose of BCAs (See ACEEE 2020 Three Rs; NARUC 2019). However, some studies have offered frameworks for how resilience impacts could be calculated (See NARUC & NASEO 2022; IPI 2018, pages 16-19).
Resilience impacts can be estimated by comparing the resilience metrics from a baseline scenario with those from a scenario that includes the proposed DERs, using the steps shown in Table 78.
Table 78. Steps to assess resilience impacts
| Step 1 |
Characterize the threats
These might include extreme weather events, earthquakes, wildfires, cyberattacks, and more (see U.S. DOE 2017, pages 4-26 to 4-27). The threats might vary in type and magnitude across states. Ideally, probabilities for the different threats would be developed in order to prioritize them, weight them, and apply risk assessment techniques to them (see Chapter 6). |
| Step 2 |
Define resilience metrics
This requires identifying metrics that can be used to define, assess, and prioritize resilience impacts. There are many such metrics available for this purpose (see Table 79). For the purpose of assessing resilience in a BCA, it may be useful and practical to focus on a subset of relevant of metrics that address key areas of resilience, such as critical customer-hours of outages, time to recovery, and critical services without power.
Depending upon the DER type and the goal of the BCA, it might be useful to apply these metrics to different perspectives and customer types. For example, these metrics could be characterized and reported according to whether they apply to the utility system, the host customer, or society. In addition, some of these metrics could be further characterized according to critical versus non-critical customers. |
| Step 3 |
Define and quantify baseline resilience
This is equivalent to developing a Reference Case, where the relevant resilience metrics (from Step 2) are quantified and presented to indicate the level of resilience that would be expected without the DERs being evaluated in the BCA. |
| Step 4 |
Characterize potential resilience impacts of DERs
This critical step includes an assessment of the potential for the proposed DERs to affect the resilience metrics (from Step 2). This requires a thorough analysis of the DER type and load impact profile, including the extent to which the proposed DER has the resilience traits outlined above in Section 8.2.1. Some DER types, such as energy efficiency and distributed PV, might passively affect resilience by simply reducing load during peak hours. Other DER types, such as demand response and distributed storage, might actively affect resilience by operating at times when additional power is needed. Still other types of DERs, including micro-grids or combinations of distributed PV and storage, can continue to provide electricity service to host customers during an outage. These different types of resilience impacts should be identified for each DER type. |
| Step 5 |
Quantify resilience impacts from proposed DERs
This is equivalent to developing a DER Case, where the resilience metrics (from Step 2) are quantified and presented to indicate the level of resilience that would be expected as a result of installing those DERs. |
| Step 6 |
Calculate net resilience impacts of proposed DERs
This requires subtracting the resilience impacts from the DER Case (from Step 5) from the resilience impacts of the Reference case (from Step 3). |
| Step 7 |
Calculate dollar values of resilience impacts
This requires applying a dollar value to the relevant resilience metrics. For example, the critical customer-hours of outage (in hours per year) can be multiplied by the loss of assets or the business interruption costs (in dollars per hour) to calculate the value of the change in resilience (in dollars per year). Methods for determining the dollar value of resilience are discussed below. |
In some cases, an additional step may be warranted. Some resilience benefits might accrue to the utility system. Some resilience benefits might accrue to the host customer or customers, e.g., when a micro-grid or a combination of distributed generation and distributed storage allows the host or hosts to continue to have power during a power outage. Other resilience benefits might accrue to society, e.g., when a micro-grid or a combination of distributed generation and distributed storage allows a critical customer, such as a police station, fire station, or hospital, to continue to provide public services during a power outage. In those instances where the distinction between utility system, host customer, and societal impacts matters, the resilience benefits should be calculated separately for these three different perspectives.
Table 79 presents a list of resilience metrics established by the U.S. DOE. Several other sources also offer resilience metrics (see Sandia 2020 Metrics, pages 18-28; IEEE 2021, pages 12 and 13).
Table 79. DOE resilience metrics
| Impact |
Consequence Category |
Resilience Metrics |
| Direct |
Electric Service |
Cumulative customer-hours of outages |
| Cumulative customer energy demand not served |
| Average number (or %) of customers experiencing an outage during a specified time |
| Critical Electrical Service |
Cumulative critical customer-hours of outages |
| Critical customer energy demand not served |
| Average number (or %) of critical loads that experience an outage |
| Restoration |
Time to recovery |
| Cost of recovery |
| Monetary |
Loss of utility revenue |
| Cost of grid damages (e.g., repair or replace lines, transformers) |
| Cost of recovery |
| Avoided outage cost |
| Indirect |
Community Function |
Critical services without power (e.g., hospitals, fire stations, police stations) |
| Monetary |
Loss of assets and perishables |
| Business interruption costs |
| Impact on the gross municipal product or gross regional product |
| Other Critical Assets |
Key production facilities without power |
| Key military facilities without power |
Source: Recreated from IEEE 2021, page 14. For a discussion of the challenges of using VOLL in BCAs, see LBNL 2021 R&R of EE, pages 16-17.
Methods for Determining Dollar Values of Resilience
The monetary metrics for resilience can be calculated using many of the same methods and tools that are used to determine dollar values of reliability (see Section 8.1.2) In some cases, these methods might need to be tailored to better reflect the impacts of resilience. For example, customer interruption cost surveys are frequently used for determining dollar values for reliability. In the case of resilience, it will be important to survey a robust sample of critical customers. In fact, the value of reliability might even differ considerably between different types of critical customers, (for instance, between a residential customer on life-support and a wastewater processing facility).
Further, customer interruption cost surveys might be less suitable for estimating the impacts of widespread long-duration power interruptions because respondents might have no past experiences to draw upon in estimating the costs they might bear. Thus, without substantial help, respondents might not be able to fully consider the various implications of hypothetical widespread long-duration power interruptions and might have difficulty estimating their costs. Moreover, individual customers are unlikely to have knowledge of the indirect costs borne by other customers, such as the cascading economic impacts of power interruptions throughout supply chains (see LBNL 2021 Resilience, pages 17-19.)
Tools for Calculating Resilience Impacts
Several tools have been established to facilitate the development of resilience impacts. These tools are summarized in Table 77 above. Additional discussion of strengths, limitations, and uses of these tools is provided in NARUC & NASEO 2022.
8.2.3. Resources for Calculating Resilience Impacts
American Council for an Energy-Efficient Economy. 2020. (ACEEE 2020 Three Rs) Measuring the Three Rs of Energy Efficiency: Risk, Reliability, Resilience. Relf and Jarrah. January.
Federal Energy Regulatory Commission. 2018. (FERC 2018). Grid Reliability and Resilience Pricing. Docket Nos. RM18-1-000 and AD18-7-000. January 8. cms.ferc.gov/sites/default/files/2020-05/20180108161614-RM18-1-000_0.pdf.
Institute for Policy Integrity 2018. (IPI 2018). Toward Resilience: Defining, Measuring, and Monetizing Resilience in the Electricity System. Burcin Unel and Avi Zevin. August.
Lawrence Berkeley National Laboratory. 2015. (LBNL 2015). Updated Value of Service Reliability Estimates for Electric Utility Customers in the United States. Michael J. Sullivan, Josh Schellenberg, and Marshall Blundell, Nexant, Inc. January. Available at eta-publications.lbl.gov/sites/default/files/lbnl-6941e.pdf.
Lawrence Berkeley National Laboratory. 2021. (LBNL 2021 Resilience). A Hybrid Approach to Estimating the Economic Value of Enhanced System Resilience. Sunhee Baik, Nichole Hanus, Alan Sanstad, Joe Eto, Peter Larsen. February.
Lawrence Berkeley National Laboratory. 2021. (LBNL 2021 R&R of EE). Quantifying Grid Reliability and Resilience Impacts of Energy Efficiency: Examples and Opportunities. Frick, Carvallo, Schwartz. December.
Lawrence Berkeley National Laboratory. n.d. (LBNL ICE). Interruption Cost Estimator Calculator Website. www.icecalculator.com/home.
National Association of Regulatory Commissioners 2013. (NARUC 2013). Resilience in Regulated Utilities. Miles Keough and Christina Cody. November.
National Association of Regulatory Commissioners. 2019. (NARUC 2019). The Value of Resilience for Distributed Energy Resources: An Overview of Current Analytical Practices. Prepared by Converge Strategies. April.
National Association of Regulatory Commissioners. 2020. (NARUC 2020). Advancing Electric System Resilience with Distributed Energy Resources: A Review of State Policies. Kiera Zitelman. April.
National Association of Regulatory Commissioners. 2022. (NARUC & NASEO 2022). Valuing Resilience for Microgrids: Challenges, Innovative Approaches, and State Needs. Prepared by NARUC, National Association of State Energy Officials, and Converge Strategies. February. pubs.naruc.org/pub/1B571AB6-1866-DAAC-99FB-2509F05E4A67
North American Transmission Forum. 2021. (NATF 2021). Transmission Resilience Overview. May 19. https://www.natf.net/docs/natf/documents/resources/resiliency/transmission-resilience-overview.pdf
North American Electric Reliability Corporation. 2011. (NERC 2011). Methods to Model and Calculate Capacity Contributions of Variable Generation for Resource Adequacy Planning. Michael Milligan, National Renewable Energy Laboratory. April 12. www.nrel.gov/docs/fy11osti/51485.pdf.
Sandia National Laboratory. 2021. (Sandia 2021 BCA). “Application of a Standard Approach to Benefit-Cost Analysis for Electric Grid Resilience Investments.” Designing Resilient Communities: A Consequence-Based Approach for Grid Investment Report Series. SAND2021-5627. Prepared by Synapse Energy Economics and Bosque Advisors. May.
Sandia National Laboratory. 2021. (Sandia 2021 Metrics). “Performance Metrics to Evaluate Utility Resilience Investments.” Designing Resilient Communities: A Consequence-Based Approach for Grid Investment Report Series. SAND2021-5919. Prepared by Synapse Energy Economics. May.
U.S. Department of Energy. 2013. (U.S. DOE 2013). Presidential Policy Directive 21 (PPD-21): Critical Infrastructure Security and Resilience. February 2013. www.energy.gov/ceser/presidential-policy-directive-21.
U.S. Department of Energy. 2017. (U.S. DOE 2017). Transforming the Nation’s Electricity System: The Second Installment of the Quadrennial Energy Review. “Chapter IV: Ensuring Electricity System Reliability, Security, and Resilience.” www.energy.gov/sites/prod/files/2017/02/f34/Quadrennial%20Energy%20Review–Second%20Installment%20%28Full%20Report%29.pdf.